The following is based on and extracted from an article in The Motley Fool by Ollen Douglass and a Report from the SBA.
As of April 16, the SBA’s statistics are:
Summary

*Net Approved Dollars do not reflect the amount required for reimbursement to lenders per statute within the CARES Act.
Which businesses got the PPP funds?
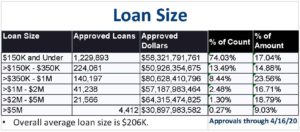
Here’s what the SBA’s funding distribution for those with approved (loans) applications or funding received:

By count, 74% of the approvals went to applicants requesting loans of $150,000 or less, and 4% went to applicants seeking loans of at least $1 million. From a dollar perspective those 4% received $152.4 billion or about 45% of the money!
Which states fared the best (and worst)?
The SBA also provided state-level PPP data. Combined with weekly unemployment claims data from the Department of Labor, it’s possible to make a state-level comparison of PPP fund allocations relative to the areas experiencing the highest unemployment claims.
According to the Department of Labor, there were 20 million initial unemployment claims filed in the four weeks ending April 11 (22 million seasonally adjusted). To index the claims to the PPP funding, we compared the percentage of PPP funds awarded to a state’s businesses to the state’s percentage of U.S. unemployment claims. An index of 1.00 means borrowers in that state received the same ratio of PPP dollars as the percentage of unemployment claims filed. An index greater than 1.00 indicates that a state received proportionally more PPP dollars.
Here are the 10 states that received the most PPP funding relative to their unemployment claims … and the 10 states that received the least:
SOURCE: SBA, DEPARTMENT OF LABOR, AND Ollen Douglass (CALCULATIONS. EXCLUDES U.S. TERRITORIES.
And here are the gory details of the whole list:

SOURCE: SBA, DEPARTMENT OF LABOR, AND Ollen Douglass (CALCULATIONS. EXCLUDES U.S. TERRITORIES.
Lastly by NAICS code:
Industry by NAICS Subsector | |||
| NAICS Subsector Description | Approved Loans | Approved Dollars | % of Amount |
| Construction | 177,905 | $44,906,538,010 | 13.12% |
| Professional, Scientific, and Technical Services | 208,360 | $43,294,713,938 | 12.65% |
| Manufacturing | 108,863 | $40,922,240,021 | 11.96% |
| Health Care and Social Assistance | 183,542 | $39,892,493,481 | 11.65% |
| Accommodation and Food Services | 161,876 | $30,500,417,573 | 8.91% |
| Retail Trade | 186,429 | $29,418,369,063 | 8.59% |
| Wholesale Trade | 65,078 | $19,489,410,472 | 5.69% |
| Other Services (except Public Administration) | 155,319 | $17,707,077,167 | 5.17% |
| Administrative and Support and Waste Management and Remediation Services | 72,439 | $15,285,814,286 | 4.47% |
| Real Estate and Rental and Leasing | 79,784 | $10,743,430,227 | 3.14% |
| Transportation and Warehousing | 44,415 | $10,598,076,231 | 3.10% |
| Finance and Insurance | 60,134 | $8,177,041,995 | 2.39% |
| Educational Services | 25,198 | $8,062,652,288 | 2.36% |
| Information | 22,825 | $6,675,630,276 | 1.95% |
| Arts, Entertainment, and Recreation | 39,670 | $4,939,280,138 | 1.44% |
| Agriculture, Forestry, Fishing and Hunting | 46,334 | $4,374,343,877 | 1.28% |
| Mining | 11,168 | $3,894,793,207 | 1.14% |
| Public Administration | 5,570 | $1,197,353,586 | 0.35% |
| Management of Companies and Enterprises | 3,211 | $1,170,748,130 | 0.34% |
| Utilities | 3,247 | $1,027,575,137 | 0.30% |
| Approvals through 4/16/20 | |||


